library(bixverse)
#> Warning: package 'bixverse' was built under R version 4.5.3
library(bixverse.gpu)
library(bixverse.plots)
library(data.table)
#> Warning: package 'data.table' was built under R version 4.5.2
library(ggplot2)
#> Warning: package 'ggplot2' was built under R version 4.5.2
GPU-accelerated workflows for bixverse single cell
2026-09-24
Intro
This vignette walks through a GPU-accelerated single cell workflow on the two-batch PBMC data set (pbmc3k + pbmc4k) used in the batch correction vignette. The point is to demonstrate how bixverse.gpu can drop into the heavier steps of a standard pipeline: PCA, Harmony v2 batch correction, and the kNN search. Two batches give us a natural reason to run all three in sequence: PCA generates the embedding, Harmony corrects it, and the kNN methods build the neighbour graph for downstream clustering. If none of this single cell stuff makes sense in the bixverse framework, please read this first.
The core idea behind bixverse.gpu is hardware-agnostic GPU code, hence the use of cubecl with the wpgu backend. For small data sets the host-to-device transfer and kernel launch overhead can outweigh the speedup, but the larger the data, the more these methods pay off (if you have sufficient VRAM/unified memory that is…).
bixverse.gpu currently provides:
-
GPU PCA via
calculate_pca_gpu_sc(): a sparse, randomised SVD where the large matrix multiplications run on GPU. Scaling (if desired) is applied without ever materialising the dense matrix. Also, option for the PFLogPF normalisation. -
GPU Harmony v2 via
harmony_v2_gpu_sc(): a GPU implementation of Harmony v2 (Patikas et al., 2026) with the Arrowhead matrix inversion. Single batch covariate only on the GPU path. R is refined via full-batch Jacobi sweeps rather than the blockwise updates of the original: faster, but results are very similar rather than bit-identical. GPU floating point reduction ordering adds small further deviations. -
GPU kNN via
find_neighbours_gpu_sc(): exhaustive (exact brute force), IVF (inverted file index, approximate) and nndescent, which prunes an NNDescent graph into a CAGRA index and supports either direct kNN extraction or beam search. -
GPU fast clustering via
fast_cluster_gpu_sc(): k-means coarsening on the GPU, then centroid kNN, optional sNN and Louvain over a resolution grid on the CPU. Only stage one is on the device, so the payoff scales with cell count. -
GPU BBKNN via
bbknn_gpu_sc(): batch-balanced kNN, one index per batch queried by every cell on the device. Corrects the graph rather than the embedding, and the win grows with the number of batches.
Note
Vignettes were built locally on a MacBook Pro M1 Max. The GH runners were just too slow and do not have proper GPU support. This gives an idea of speed on a decent, but older machine.
Loading the data
The pbmc3k and pbmc4k data sets share tissue but differ in sequencing depth and cell counts, which produces a clear batch effect.
Code
dir_data <- download_pbmc_batches()

tempdir_gpu <- file.path(tempdir(), "gpu_workflow")
dir.create(tempdir_gpu, showWarnings = FALSE, recursive = TRUE)

h5ad_files <- list.files(dir_data)
h5ad_files <- h5ad_files[grepl(".h5ad", h5ad_files)]
h5ad_paths <- file.path(dir_data, h5ad_files)
names(h5ad_paths) <- c("pbmc3k", "pbmc4k")

h5_tasks <- prescan_h5ad_files(h5_paths = h5ad_paths)

sc_object <- SingleCells(dir_data = tempdir_gpu)

sc_object <- load_multi_h5ad(
  object = sc_object,
  prescan_result = h5_tasks,
  .verbose = TRUE
)
#>  Using light streaming for the CSR to CSC conversion.
#> Loading observation data from h5ad files into DuckDB.
#> Loading variable data into DuckDB.
Quality control
Standard QC -> mitochondrial proportions, library size and complexity outliers.
Code
var <- get_sc_var(sc_object)

h5_metadata <- read_h5ad_metadata(h5ad_paths[[1]])

var <- merge(
  var,
  h5_metadata$var[, c("ENSEMBL_ID", "Symbol_TENx")],
  by.x = "gene_id",
  by.y = "ENSEMBL_ID"
)

setnames(var, old = "Symbol_TENx", new = "gene_symbol", skip_absent = TRUE)

gs_of_interest <- list(
  MT = var[grepl("^MT-", gene_symbol), gene_id],
  Ribo = var[grepl("^RPS|^RPL", gene_symbol), gene_id]
)

sc_object <- gene_set_proportions_sc(
  sc_object,
  gs_of_interest,
  streaming = FALSE,
  .verbose = TRUE
)

qc_df <- sc_object[[c("cell_id", "lib_size", "nnz", "MT")]]

metrics <- list(
  log10_lib_size = log10(qc_df$lib_size),
  log10_nnz = log10(qc_df$nnz),
  MT = qc_df$MT
)
directions <- c(
  log10_lib_size = "twosided",
  log10_nnz = "twosided",
  MT = "above"
)

qc <- run_cell_qc(
  metrics = metrics,
  cells_to_keep = get_cells_to_keep(sc_object),
  directions = directions,
  threshold = 3
)

sc_object[["outlier"]] <- qc$combined
cells_to_keep <- qc_df[!qc$combined, cell_id]
sc_object <- set_cells_to_keep(sc_object, cells_to_keep)
Highly variable genes
HVG selection stays on the CPU.
sc_object <- find_hvg_sc(
  object = sc_object,
  hvg_no = 2000L,
  .verbose = TRUE
)
GPU-accelerated PCA
However, with PCA things start changing. Let’s run first the CPU version which you know
sc_object <- calculate_pca_sc(
  object = sc_object,
  no_pcs = 32L,
  sparse_svd = TRUE
)
#> Using sparse SVD solving on scaled data on 2000 HVG.
# extract the factors and singular values
cpu_res <- get_pca_factors(sc_object)
cpu_s <- get_pca_singular_val(sc_object)
The GPU version looks very similar
sc_object <- calculate_pca_gpu_sc(object = sc_object, no_pcs = 32L)
#> Using GPU-accelerated, randomised sparse SVD data with 2000 HVG.
gpu_res <- get_pca_factors(sc_object)
gpu_s <- get_pca_singular_val(sc_object)
Let’s compare against the CPU version:
ggplot(
  data = data.table(PC1_cpu = cpu_res[, 1], PC1_gpu = gpu_res[, 1]),
  mapping = aes(x = PC1_cpu, y = PC1_gpu)
) +
  geom_point() +
  theme_bw() +
  xlab("PC1 (CPU)") +
  ylab("PC1 (GPU)") +
  ggtitle("CPU vs GPU")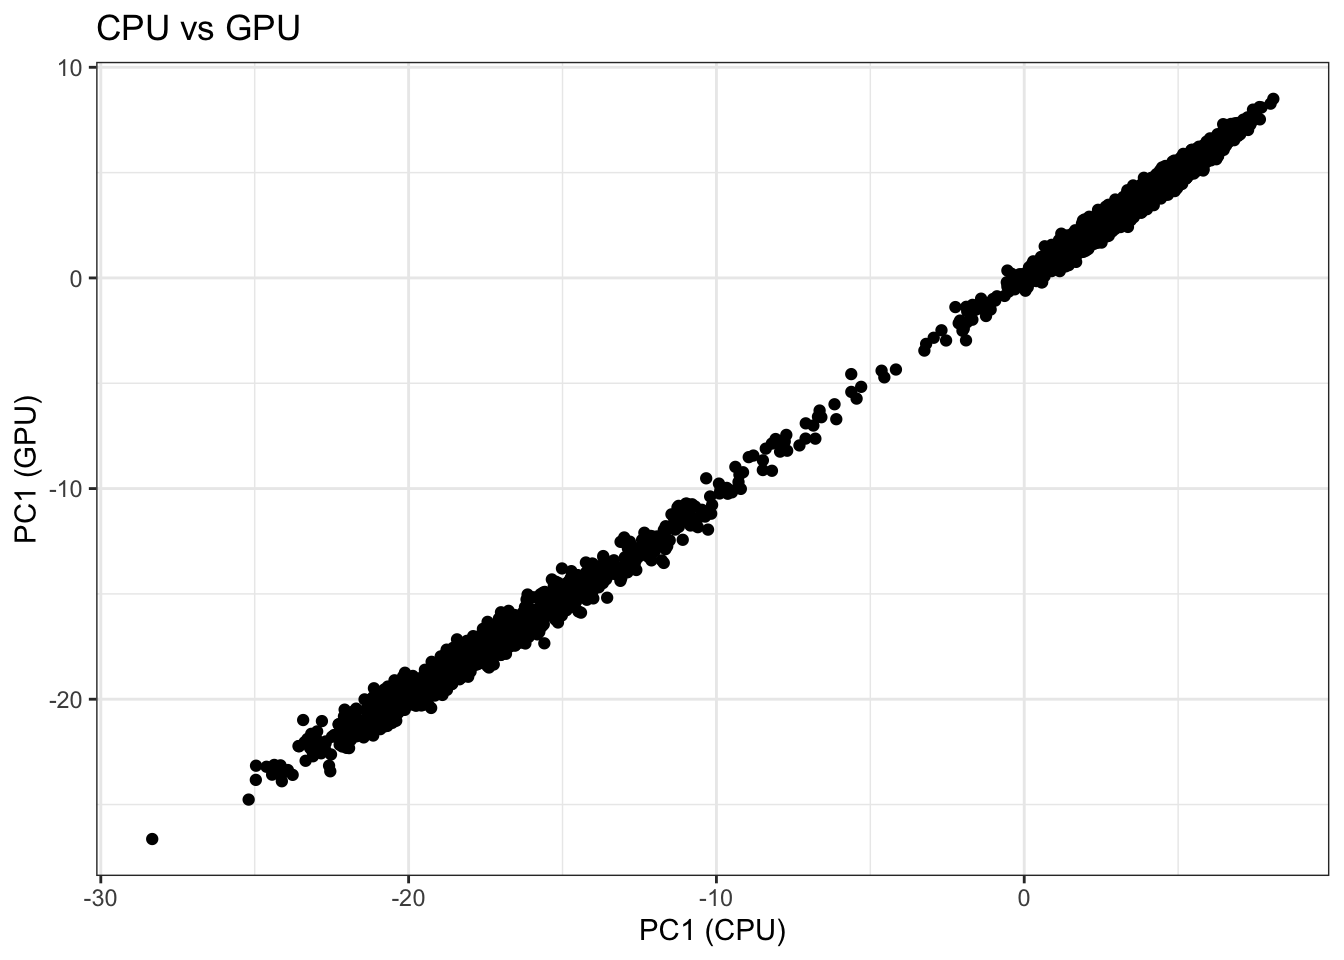
ggplot(
  data = data.table(sv_cpu = cpu_s, sv_gpu = gpu_s),
  mapping = aes(x = sv_cpu, y = sv_gpu)
) +
  geom_point() +
  theme_bw() +
  xlab("Singular values (CPU)") +
  ylab("Singular values (GPU)") +
  ggtitle("CPU vs GPU")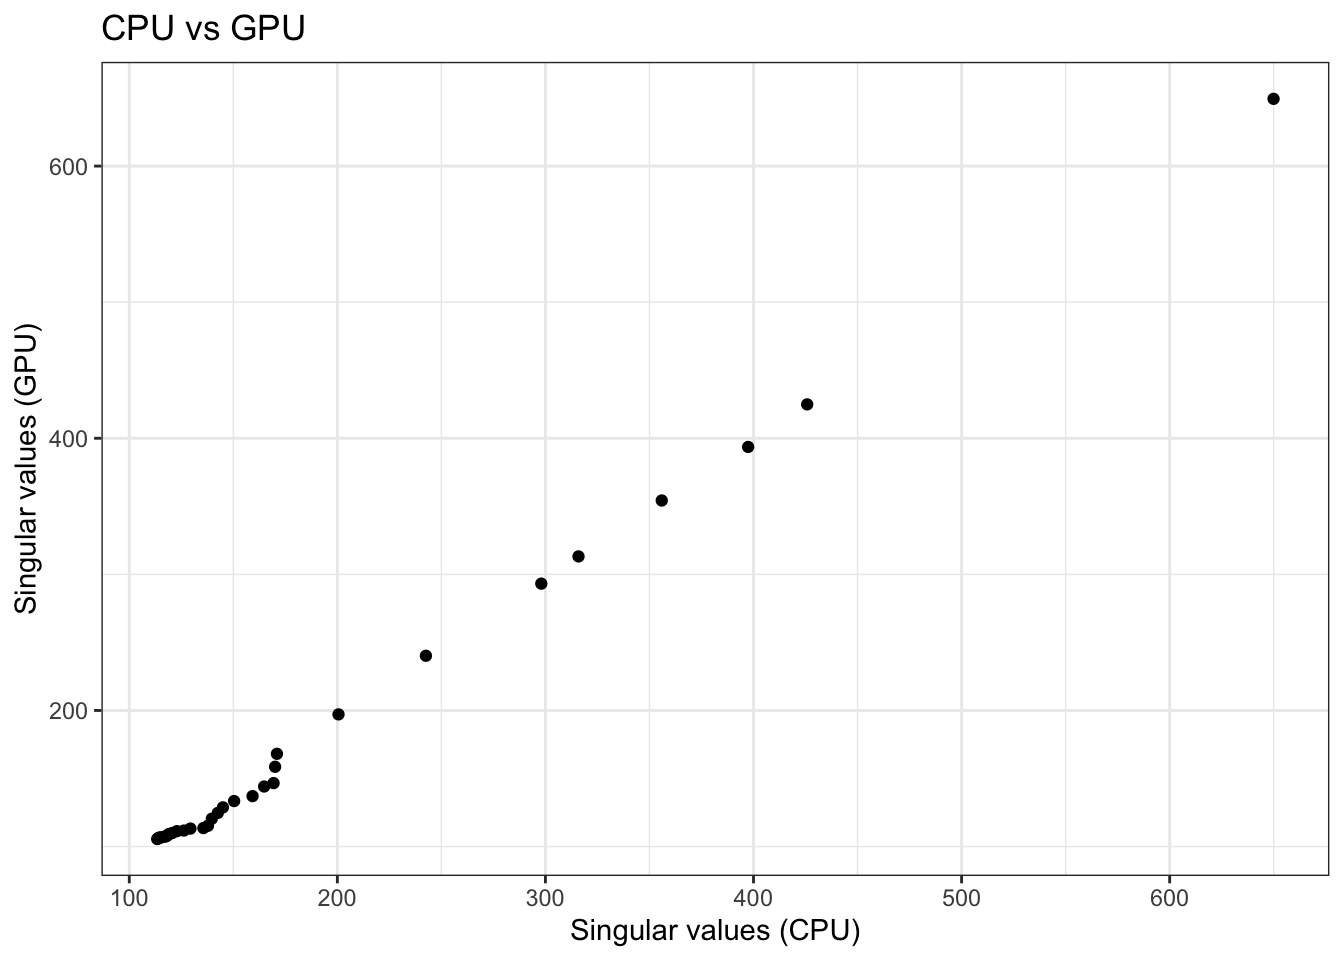
You might see some slight differences here driven by floating operation differences between CPU and GPU. The overall data structure is however clearly captured.
GPU-accelerated Harmony v2
With two batches we need batch correction. harmony_v2_gpu_sc() runs Harmony v2 with the Arrowhead inversion on GPU and writes the corrected embedding to the object as "harmony_gpu".
sc_object <- harmony_v2_gpu_sc(
  object = sc_object,
  batch_column = "exp_id",
  harmony_params = params_sc_harmony_v2_gpu()
)
#>  Auto-determined number of Harmony clusters: 100
For comparison, the CPU version of v2; stored as "harmony_v2" so both embeddings coexist.
sc_object <- harmony_v2_sc(
  object = sc_object,
  batch_column = "exp_id",
  harmony_params = params_sc_harmony_v2()
)
#>  Auto-determined number of Harmony clusters: 100
We will compare the two below, but only once we have kNN graphs on each embedding, since most of the batch correction metrics need a neighbourhood structure to begin with. Which is a convenient segue.
GPU-accelerated kNN
Three methods, each with different speed/precision trade-offs. Below we run all three against the GPU Harmony embedding to show the API. In practice, pick one based on data size and how exact you need the neighbours to be.
Exhaustive
Exact brute-force search on GPU. Best for smaller data sets or whenever you need exact neighbours. Scales quadratically, so it gets painful on large data.
sc_object <- find_neighbours_gpu_sc(
  object = sc_object,
  embd_to_use = "harmony_gpu",
  knn_method = "exhaustive",
  nn_params = params_nn_gpu(dist_metric = "euclidean"),
  k = 15L,
  .verbose = TRUE
)
#> Generating GPU kNN data with exhaustive method.
#> Generating sNN graph (full: TRUE).
#> Transforming sNN data to igraph.
IVF
Inverted file index. Partitions the embedding space into Voronoi cells and probes only a subset at query time. Worthwhile on larger data sets. The key knobs (n_list and n_probes) live in params_nn_gpu(); defaults are fine here.
sc_object <- find_neighbours_gpu_sc(
  object = sc_object,
  embd_to_use = "harmony_gpu",
  knn_method = "ivf",
  nn_params = params_nn_gpu(),
  .verbose = TRUE
)
#> Generating GPU kNN data with ivf method.
#> Generating sNN graph (full: TRUE).
#> Transforming sNN data to igraph.
CAGRA
Builds a pruned NNDescent graph, based on the fantastic work by Nvidia. (Unfortunately, some of the cuda primitives are not available in wgpu, but it is still a blazingly fast approximate kNN search even on wgpu). With extract_knn = TRUE you pull the kNN straight out of the NNDescent graph: faster, slightly less precise, useful for rapid iteration over parameters. With extract_knn = FALSE (the default) the function runs beam search over the pruned graph for higher recall, which matters more on larger, higher-dimensional data.
sc_object <- find_neighbours_gpu_sc(
  object = sc_object,
  embd_to_use = "harmony_gpu",
  knn_method = "nndescent",
  nn_params = params_nn_gpu(extract_knn = FALSE),
  .verbose = TRUE
)
#> Generating GPU kNN data with nndescent method.
#> Generating sNN graph (full: TRUE).
#> Transforming sNN data to igraph.
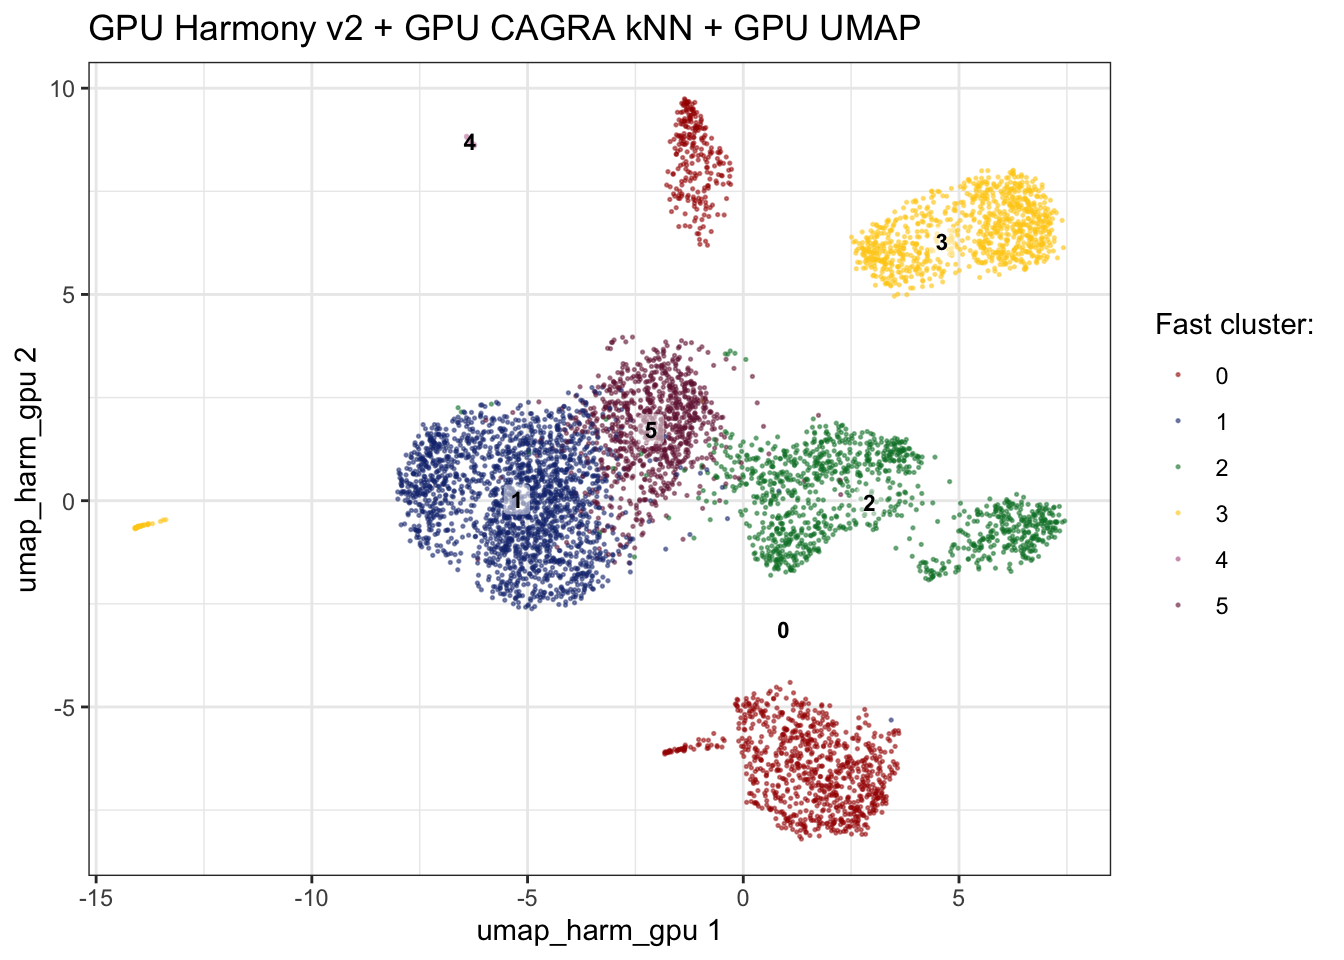
From here downstream methods, clustering, UMAP/tSNE, marker detection, work without modification, exactly as after a find_neighbours_sc() call.
GPU-accelerated fast clustering
Clustering every cell directly gets painful fast. fast_cluster_gpu_sc() coarsens instead: k-means over the embedding, a kNN (optionally sNN) graph on the centroids, Louvain over a set of resolutions on that much smaller graph, then the memberships projected back down to the cells. Only the k-means runs on the device, so the win tracks how much of the run k-means owns. On a few thousand PBMCs that share is small; on millions of cells it is most of it.
grid_search = TRUE repeats the Louvain step across several seeds per resolution and hands back stability numbers, which is how you pick a resolution without eyeballing a UMAP.
fast_cluster_res <- fast_cluster_gpu_sc(
  object = sc_object,
  embd_to_use = "harmony_gpu",
  resolutions = c(2, 1.5, 1, 0.5),
  return_kmeans = TRUE,
  grid_search = TRUE,
  no_seeds = 25L
)

fast_cluster_res
#> SingleCellFastClusters: 5841 cells, 4 resolutions
#>   Resolutions: 2, 1.5, 1, 0.5
#>   Grid stats stored: TRUE
#>   k-means stored:    TRUE
One column per resolution, keyed by cell_idx:
The grid stats are the interesting bit. mean_ari is how stable the partition is across seeds, mean_conductance how well separated the communities are (lower is better), and mean_n_comms how many you end up with.
fast_cluster_res$stats
#>    resolution  mean_ari median_ari mean_conductance median_conductance
#>         <num>     <num>      <num>            <num>              <num>
#> 1:        2.0 0.9235639  0.8987854      0.025006620                  0
#> 2:        1.5 0.9353009  0.9689155      0.014672038                  0
#> 3:        1.0 0.9293569  0.9689155      0.009172788                  0
#> 4:        0.5 0.9407509  1.0000000      0.003602102                  0
#>    mean_n_comms
#>           <num>
#> 1:         7.24
#> 2:         6.96
#> 3:         6.72
#> 4:         6.32
The k-means centroids and per-cell assignments are there too, if you asked for them:
dim(get_centroids_sc(fast_cluster_res))
#> [1] 76 32

head(get_kmeans_clusters(fast_cluster_res))
#> [1] 35  3 70 13 66 46
Push the memberships onto the object and they behave like any other obs column:
sc_object <- add_sc_new_obs(
  object = sc_object,
  obs_data = get_data(fast_cluster_res)
)

head(sc_object)
#>    cell_idx  cell_id exp_id barcode_type cell_ranger_version   chemistry
#>       <int>   <char> <char>       <fctr>              <fctr>      <fctr>
#> 1:        1 pbmc3k_0 pbmc3k      GemCode              v1.1.0 Chromium_v1
#> 2:        2 pbmc3k_1 pbmc3k      GemCode              v1.1.0 Chromium_v1
#> 3:        3 pbmc3k_2 pbmc3k      GemCode              v1.1.0 Chromium_v1
#> 4:        4 pbmc3k_3 pbmc3k      GemCode              v1.1.0 Chromium_v1
#> 5:        6 pbmc3k_5 pbmc3k      GemCode              v1.1.0 Chromium_v1
#> 6:        7 pbmc3k_6 pbmc3k      GemCode              v1.1.0 Chromium_v1
#>    date_published    individual sample sequence_platform          barcode
#>            <fctr>        <fctr> <fctr>            <fctr>           <char>
#> 1:     2016-05-26 HealthyDonor2 pbmc3k        NextSeq500 AAACATACAACCAC-1
#> 2:     2016-05-26 HealthyDonor2 pbmc3k        NextSeq500 AAACATTGAGCTAC-1
#> 3:     2016-05-26 HealthyDonor2 pbmc3k        NextSeq500 AAACATTGATCAGC-1
#> 4:     2016-05-26 HealthyDonor2 pbmc3k        NextSeq500 AAACCGTGCTTCCG-1
#> 5:     2016-05-26 HealthyDonor2 pbmc3k        NextSeq500 AAACGCACTGGTAC-1
#> 6:     2016-05-26 HealthyDonor2 pbmc3k        NextSeq500 AAACGCTGACCAGT-1
#>    library       sequence   nnz lib_size to_keep         MT      Ribo outlier
#>      <int>         <char> <num>    <num>  <lgcl>      <num>     <num>  <lgcl>
#> 1:       1 AAACATACAACCAC   771     2390    TRUE 0.03054393 0.4401674   FALSE
#> 2:       1 AAACATTGAGCTAC  1342     4890    TRUE 0.03803681 0.4243354   FALSE
#> 3:       1 AAACATTGATCAGC  1117     3135    TRUE 0.00893142 0.3180223   FALSE
#> 4:       1 AAACCGTGCTTCCG   946     2622    TRUE 0.01754386 0.2429443   FALSE
#> 5:       1 AAACGCACTGGTAC   777     2159    TRUE 0.01667439 0.3626679   FALSE
#> 6:       1 AAACGCTGACCAGT   774     2161    TRUE 0.03840815 0.4183249   FALSE
#>    res_2 res_1.5 res_1 res_0.5
#>    <int>   <int> <int>   <int>
#> 1:     1       1     1       1
#> 2:     3       3     3       3
#> 3:     5       5     5       5
#> 4:     6       0     0       0
#> 5:     5       5     5       5
#> 6:     2       2     2       2
Comparing GPU vs CPU Harmony
With the kNN graph in place on the GPU Harmony embedding, we can compute batch metrics for it and then repeat the kNN step on the CPU embedding to compare.
kbet_gpu <- calculate_kbet_sc(sc_object, batch_column = "exp_id")
asw_gpu <- calculate_batch_asw_sc(
  sc_object,
  embd_to_use = "harmony_gpu",
  batch_column = "exp_id"
)
lisi_gpu <- calculate_lisi_sc(
  sc_object,
  label_column = "exp_id",
  type = "batch"
)

kbet_gpu
#> kBET Scores
#>   Cells: 5841 | Batches: 2 | Threshold: 0.050
#>   Rejection rate:      0.2679 (1565 / 5841)
#>   Mean Chi-Square:     3.0562 (expected under H0: 1)
#>   Median Chi-Square:   1.9151
asw_gpu
#> Batch Silhouette Width
#>   Cells: 5000 | Batches: 2
#>   Mean ASW:    0.0238 (-1 = strong intermixing, 0 = mixed, 1 = separated)
#>   Median ASW:  0.0456
lisi_gpu
#> iLISI (batch)
#>   Cells: 5841 | Labels: 2
#>   Mean LISI:    1.4609
#>   Median LISI:  1.4706
#>   Normalised:   0.4706 (0 = worst, 1 = best)
Same kNN setup on the CPU Harmony embedding:
sc_object <- find_neighbours_gpu_sc(
  object = sc_object,
  embd_to_use = "harmony_v2",
  knn_method = "nndescent",
  nn_params = params_nn_gpu(extract_knn = FALSE),
  .verbose = TRUE
)
#> Generating GPU kNN data with nndescent method.
#> Generating sNN graph (full: TRUE).
#> Transforming sNN data to igraph.

kbet_cpu <- calculate_kbet_sc(sc_object, batch_column = "exp_id")
asw_cpu <- calculate_batch_asw_sc(
  sc_object,
  embd_to_use = "harmony_v2",
  batch_column = "exp_id"
)
lisi_cpu <- calculate_lisi_sc(
  sc_object,
  label_column = "exp_id",
  type = "batch"
)

kbet_cpu
#> kBET Scores
#>   Cells: 5841 | Batches: 2 | Threshold: 0.050
#>   Rejection rate:      0.2686 (1569 / 5841)
#>   Mean Chi-Square:     3.0453 (expected under H0: 1)
#>   Median Chi-Square:   1.9151
asw_cpu
#> Batch Silhouette Width
#>   Cells: 5000 | Batches: 2
#>   Mean ASW:    0.0245 (-1 = strong intermixing, 0 = mixed, 1 = separated)
#>   Median ASW:  0.0452
lisi_cpu
#> iLISI (batch)
#>   Cells: 5841 | Labels: 2
#>   Mean LISI:    1.4634
#>   Median LISI:  1.4706
#>   Normalised:   0.4706 (0 = worst, 1 = best)
Harmony has stochastic elements, so the two embeddings will not be identical, but the batch correction quality should be in the same ballpark across the metrics.
UMAP on the GPU Harmony embedding
Everyone loves visuals, even if you should not over-interpret them (Chari et al., 2023). umap_gpu_sc() runs the full GPU-accelerated UMAP path: GPU kNN plus a GPU Adam optimiser (optimiser = "adam_gpu" in params_umap_gpu(), the default). On the CAGRA kNN we just computed above, it plugs straight in with use_knn = TRUE.
sc_object <- find_neighbours_gpu_sc(
  object = sc_object,
  embd_to_use = "harmony_gpu",
  knn_method = "nndescent",
  nn_params = params_nn_gpu(extract_knn = FALSE),
  .verbose = TRUE
)
#> Generating GPU kNN data with nndescent method.
#> Generating sNN graph (full: TRUE).
#> Transforming sNN data to igraph.

sc_object <- umap_gpu_sc(
  object = sc_object,
  embd_to_use = "harmony_gpu",
  slot_name = "umap_harm_gpu",
  use_knn = TRUE
)
#> Running GPU UMAP.
#> Using n_epochs = 500 (dataset <10k samples or 'adam_parallel'/'adam_gpu' optimiser)
#> Using provided kNN graph.
embedding_plot_sc(
  sc_object,
  embedding = "umap_harm_gpu",
  colour_by = "res_1",
  label_by = "res_1",
  discrete = TRUE
) +
  labs(
    title = "GPU Harmony v2 + GPU CAGRA kNN + GPU UMAP",
    colour = "Fast cluster:"
  )
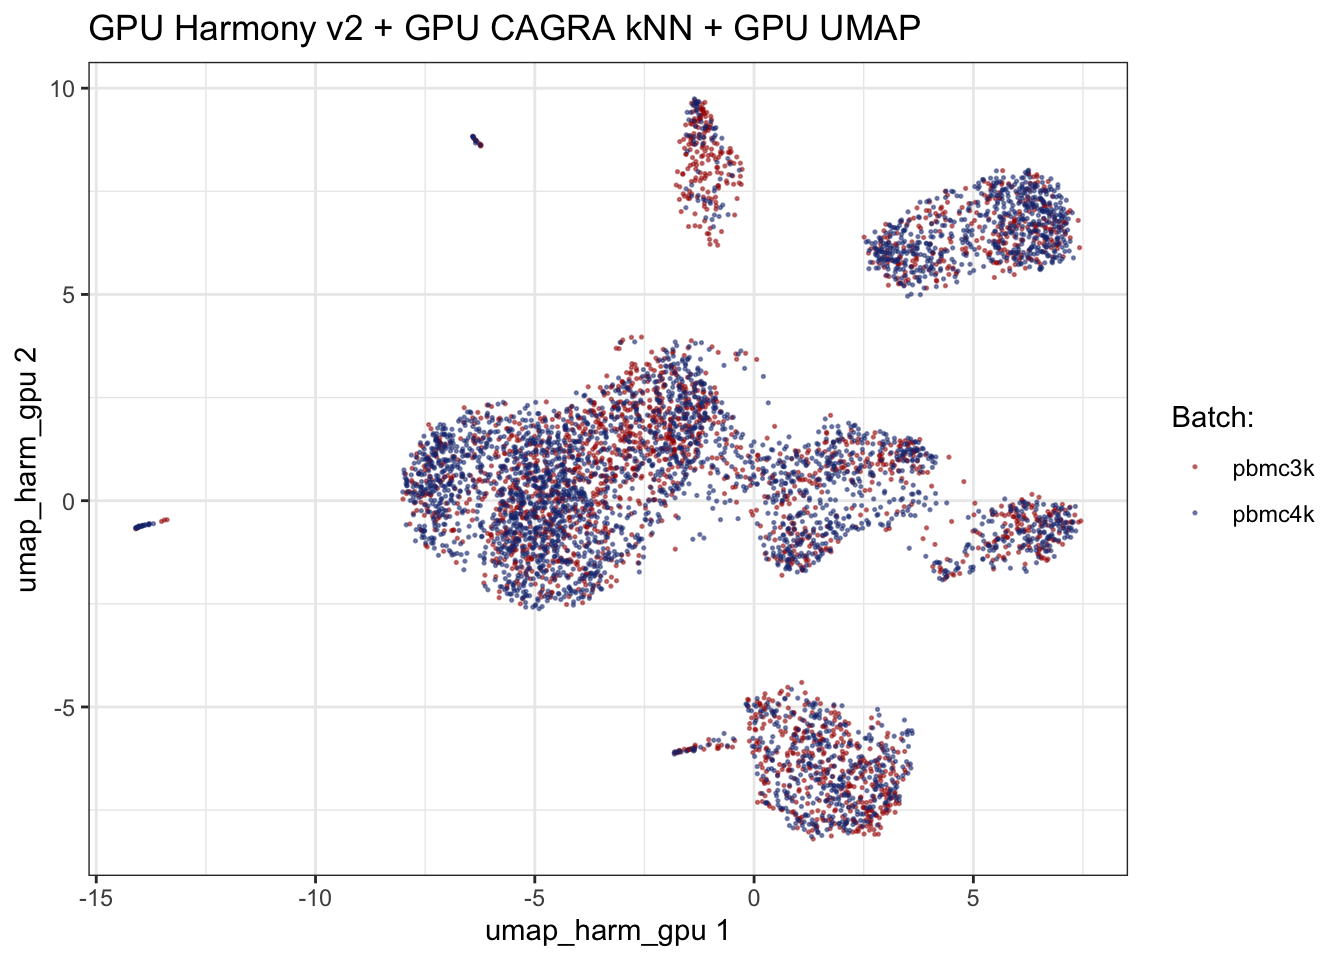
Same embedding, coloured by batch, to check the correction held up:
embedding_plot_sc(
  sc_object,
  embedding = "umap_harm_gpu",
  colour_by = "exp_id",
  discrete = TRUE
) +
  labs(
    title = "GPU Harmony v2 + GPU CAGRA kNN + GPU UMAP",
    colour = "Batch:"
  )
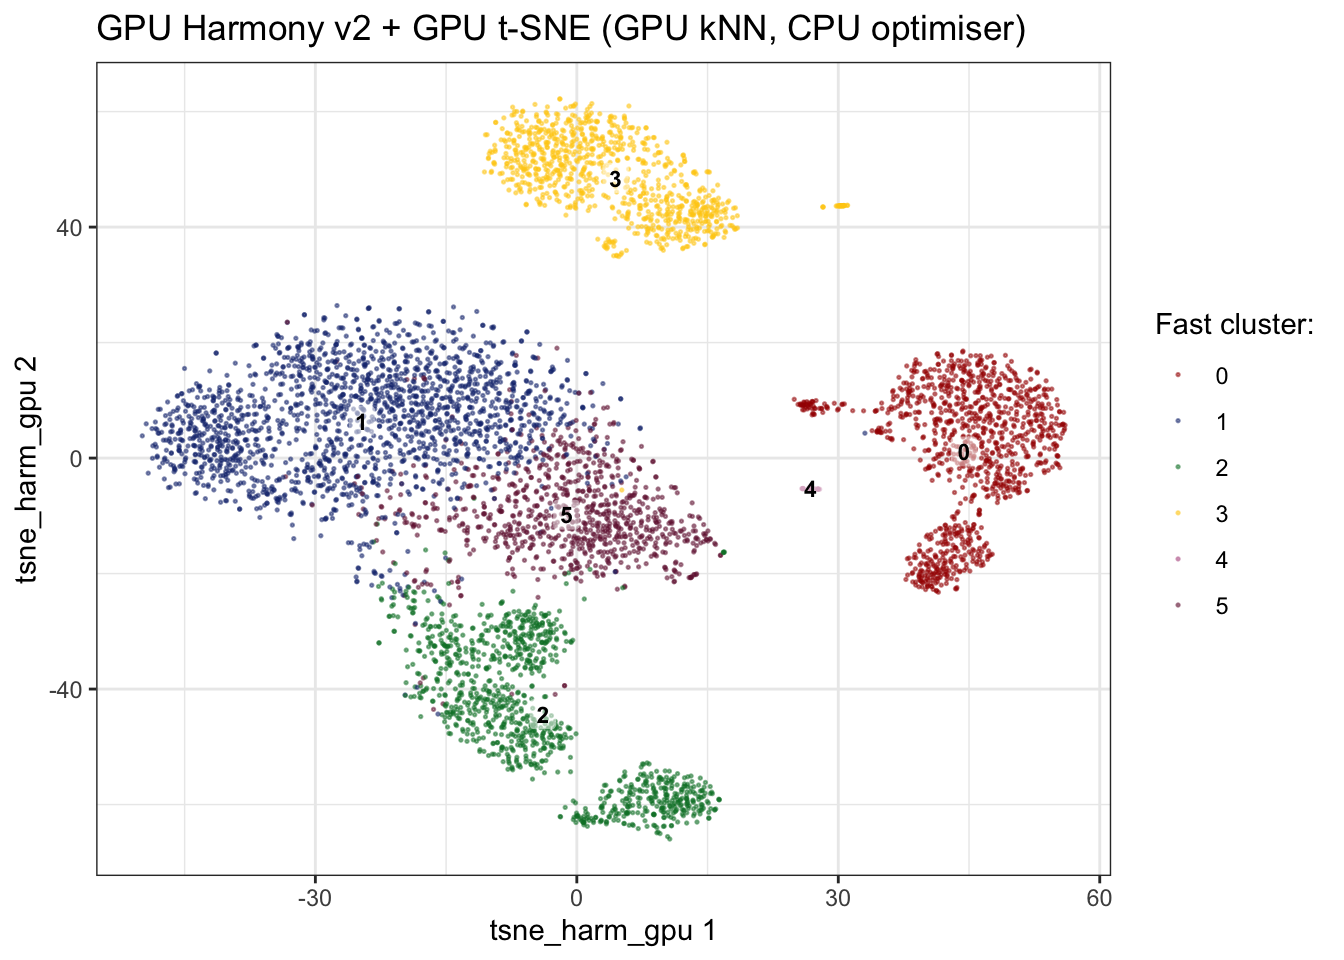
tSNE on the GPU Harmony embedding
tsne_gpu_sc() mirrors the shape of umap_gpu_sc() but only the kNN step runs on GPU. The optimiser (Barnes-Hut or FIt-SNE FFT) still runs on CPU; a GPU optimiser is on the roadmap. Because t-SNE derives k from 3 * perplexity on the Rust side, use_knn defaults to FALSE so that every call builds a fresh GPU kNN sized to the requested perplexity. Handy when sweeping perplexities.
sc_object <- tsne_gpu_sc(
  object = sc_object,
  embd_to_use = "harmony_gpu",
  slot_name = "tsne_harm_gpu",
  perplexity = 30.0
)
#> Running GPU t-SNE.
embedding_plot_sc(
  sc_object,
  embedding = "tsne_harm_gpu",
  colour_by = "res_1",
  label_by = "res_1",
  discrete = TRUE
) +
  labs(
    title = "GPU Harmony v2 + GPU t-SNE (GPU kNN, CPU optimiser)",
    colour = "Fast cluster:"
  )
GPU-accelerated BBKNN
Everything above corrects the embedding and then builds a neighbour graph on it. BBKNN (Polański et al., 2020) takes the other route: leave the embedding alone and fix the graph instead. It builds one index per batch, asks every cell for its neighbours_within_batch nearest neighbours in each, and then runs the UMAP connectivity calculations over the union to drop spurious edges. Batch mixing falls out of the construction, because every cell is forced to have neighbours in every batch.
bbknn_gpu_sc() puts the per-batch searches on the device. That is the part that scales badly on CPU: the work grows as n_cells * n_batches, so two batches is barely worth it and thirty samples very much is.
Note this overwrites the kNN and the graph on the object, which is why it comes last here. The graph weights are the BBKNN connectivities, not shared nearest neighbour counts.
sc_object <- bbknn_gpu_sc(
  object = sc_object,
  batch_column = "exp_id",
  no_neighbours_to_keep = 15L,
  bbknn_params = params_sc_bbknn_gpu(neighbours_within_batch = 10L)
)
#> Warning in .bbknn_gpu(object = object, batch_column = batch_column,
#> no_neighbours_to_keep = no_neighbours_to_keep, : Prior kNN matrix found. Will
#> be overwritten.
#> Running BBKNN algorithm on the GPU.
#> Generating graph based on BBKNN connectivities. Weights will be based on the connectivities and not shared nearest neighbour calculations.

dim(get_knn_mat(sc_object))
#> [1] 5841   15
Setting no_neighbours_to_keep below the total generated (10 per batch across 2 batches, so 20) is what makes the distance filtering do anything. Ask for more than that and you get a warning and all of them.
For the metrics, kBET is the wrong tool here. It compares each neighbourhood against the global batch proportions, which is precisely the quantity BBKNN manipulates by construction, so it will report glowing results whether or not anything useful happened. LISI on the stored kNN is the honest choice, and ASW needs an embedding that BBKNN never produces.
lisi_bbknn <- calculate_lisi_sc(
  sc_object,
  label_column = "exp_id",
  type = "batch"
)
lisi_bbknn
#> iLISI (batch)
#>   Cells: 5841 | Labels: 2
#>   Mean LISI:    1.7999
#>   Median LISI:  1.8000
#>   Normalised:   0.8000 (0 = worst, 1 = best)
With two batches, perfect mixing means a LISI of 2 and no mixing means 1.
The GPU and CPU paths agree exactly when the search is exhaustive, since both are exact and recompute their distances against the same embedding. The approximate backends ("ivf", "nndescent") break ties differently and will not, though they land in the same place.
Conclusions
The full GPU path (PCA, Harmony v2, kNN, fast clustering, UMAP with GPU Adam optimiser, t-SNE with GPU kNN, BBKNN) plugs into the existing SingleCells workflow without any glue code. The downstream object behaves identically to whatever you would get from the CPU equivalents.
Still on CPU and an obvious next candidate:
- fastMNN (paper, CPU implementation)
One caveat worth carrying forward on the kNN backends. NN-descent is a low-k method on the GPU: its build degree tracks k, so the descent does more work per node as k climbs, while the exhaustive scan barely notices k at all. Past k of roughly 30 the exact search wins, and by k = 200 it wins by more than an order of magnitude. Reach for IVF instead when brute force gets slow. Watch this space.
Clean up
unlink(tempdir_gpu, recursive = TRUE, force = TRUE)