
Plot Scrublet score distributions
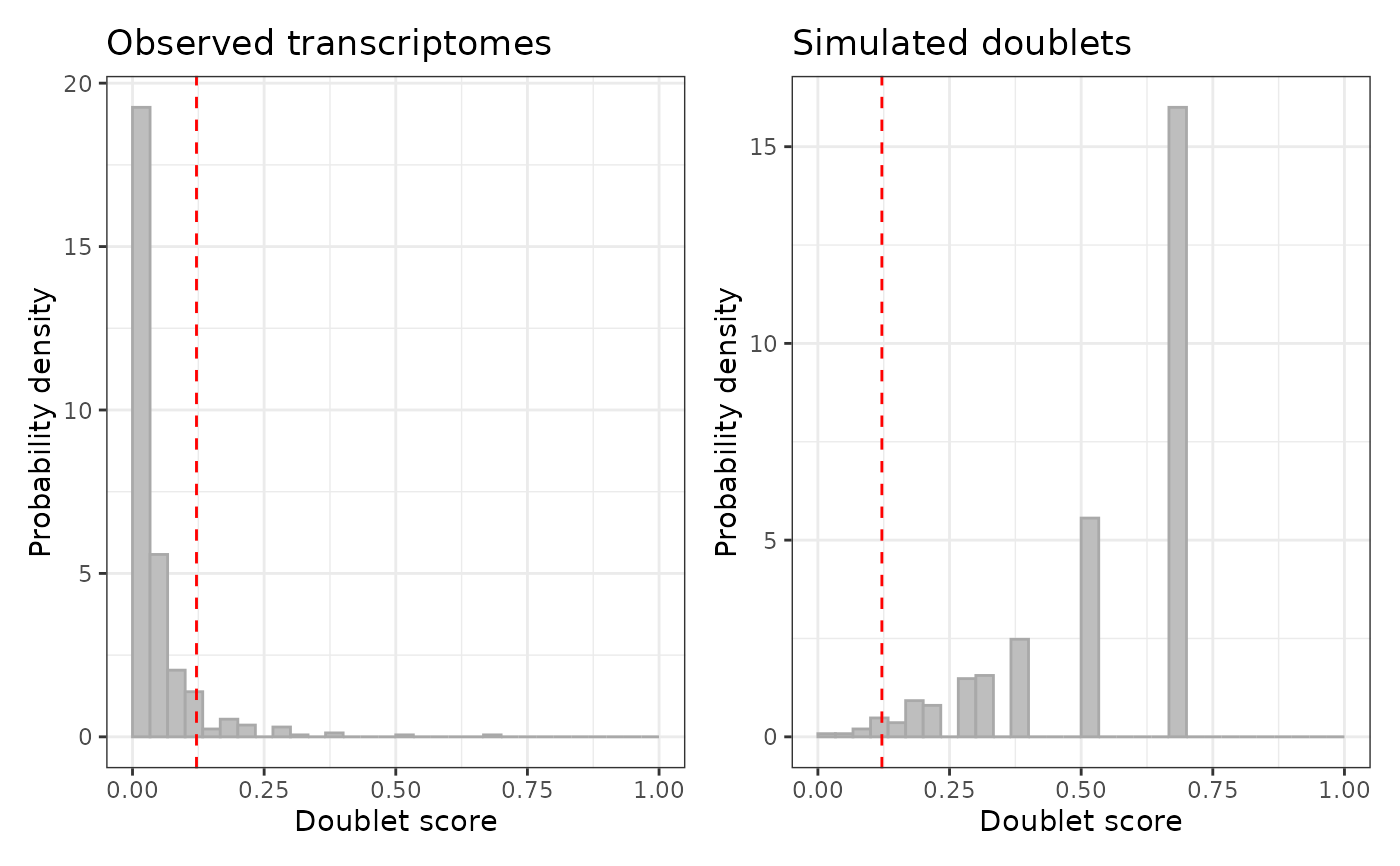
plot.ScrubletRes.RdPlots histograms of doublet scores for observed transcriptomes and simulated doublets side by side. The threshold is shown as a dashed red vertical line. For grouped results, plots a single group at a time.
Usage
# S3 method for class 'ScrubletRes'
plot(x, break_number = 31L, for_sample = NULL, ...)Examples
# observed against simulated doublet scores
sc <- demo_single_cells(prepped = FALSE)
res <- scrublet_sc(
sc,
scrublet_params = params_scrublet(
pca = list(no_pcs = 10L),
hvg = list(min_gene_var_pctl = 0.0),
n_bins = 20L
),
.verbose = FALSE
)
plot(res)
 unlink(sc@dir_data, recursive = TRUE, force = TRUE)