Plot the highly variable genes
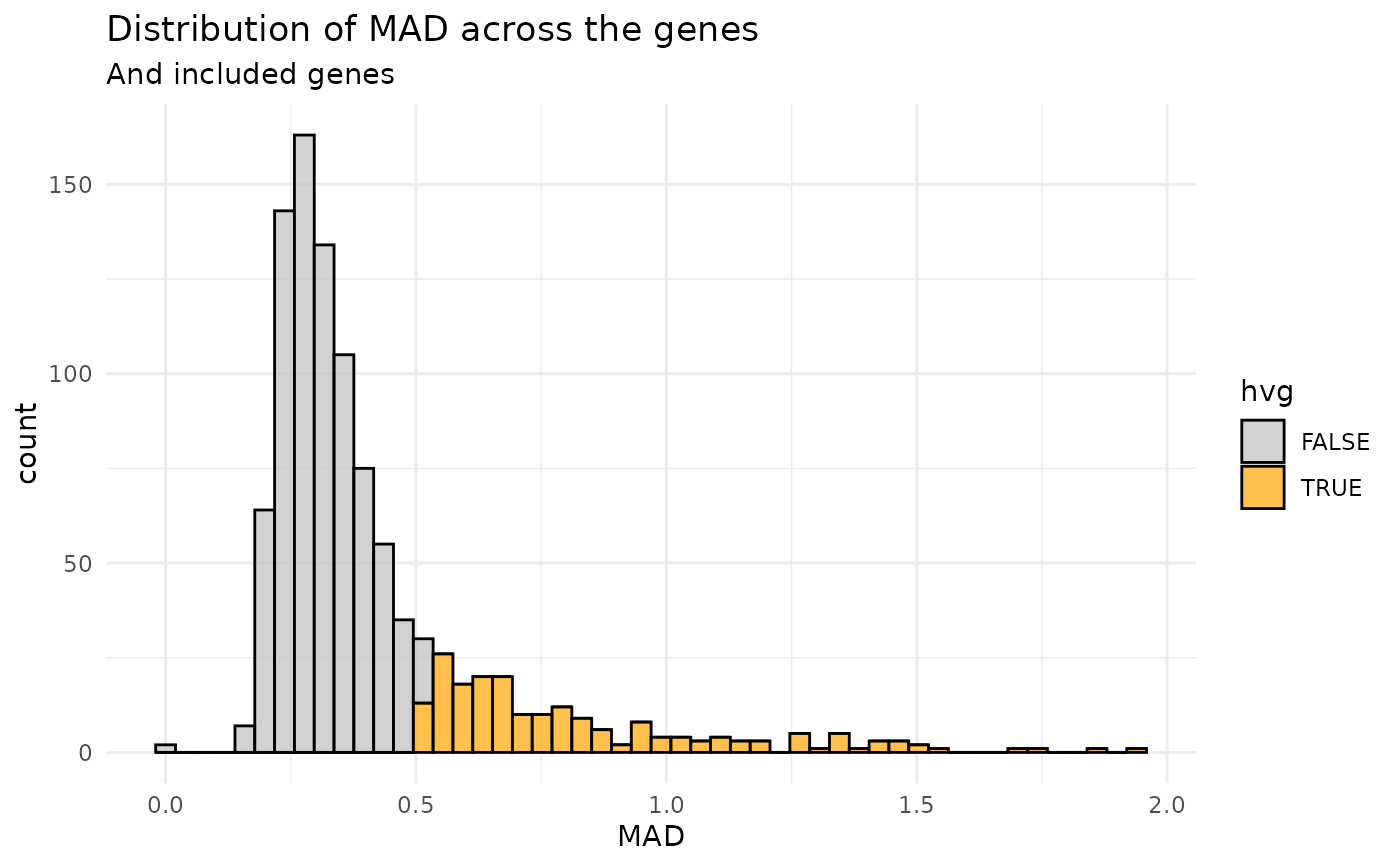
plot_hvgs.RdPlots the median-absolute deviation of the genes and applied thresholds.
Expects that preprocess_bulk_coexp() was run and will throw an
error otherwise.
Arguments
- object
The underlying class, see
BulkCoExp().- bins
Integer. Number of bins to plot.
Examples
# MAD distribution with the selected genes highlighted
syn <- synthetic_bulk_cor_matrix()
mat <- log1p(t(syn$counts))
meta <- data.table::data.table(sample_id = rownames(mat))
object <- BulkCoExp(raw_data = mat, meta_data = meta)
object <- preprocess_bulk_coexp(object, hvg = 200L, .verbose = FALSE)
plot_hvgs(object)