Plot various parameters with no comp
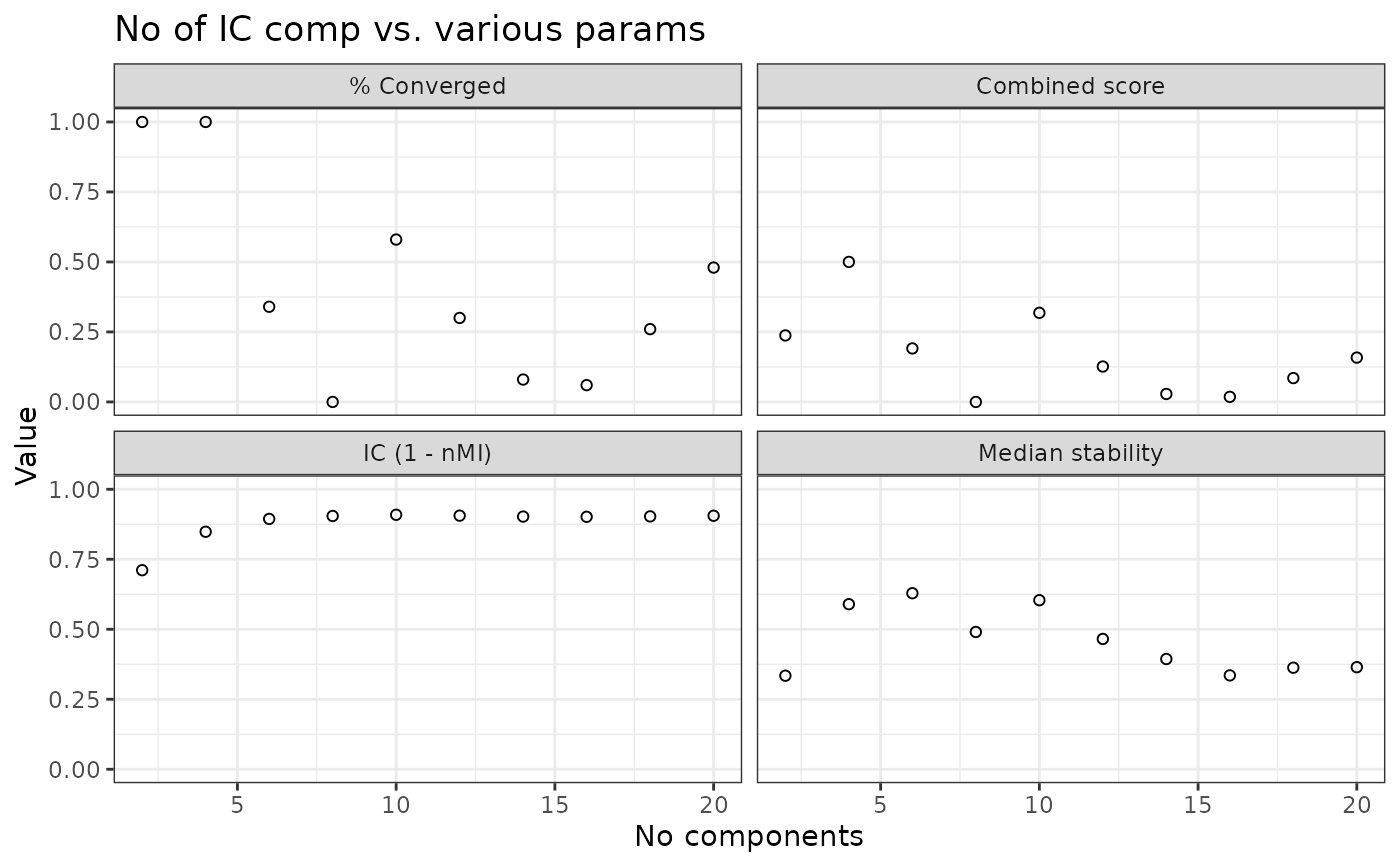
plot_ica_ncomp_params.RdHelper function to plot various parameters with the no of components. You have:
Median stability - The median stability of the clusters at this no of components given random initialisations.
% Converged - The percentage of ICA runs that converged at this no of components.
IC Orthogonality - The orthogonality (measured as
1 - abs(cos)) indicating how orthogonal the signals detected at this level are.Combined score - The product of the three other scores.
If found, the function will also add the optimal number of components based
on ica_optimal_ncomp() (if a loess function could be fitted).
Arguments
- object
The class, see
BulkCoExp(). You need to applyica_evaluate_comp()before running this function.
Examples
# stability, convergence and orthogonality against ncomp
mat <- t(synthetic_signal_matrix()$mat)
obj <- BulkCoExp(mat, data.table::data.table(sample_id = rownames(mat)))
obj <- preprocess_bulk_coexp(obj, hvg = 0.3, .verbose = FALSE)
obj <- ica_processing(obj, .verbose = FALSE)
obj <- ica_evaluate_comp(
  obj,
  ica_type = "logcosh",
  ncomp_params = params_ica_ncomp(custom_seq = seq(2L, 20L, by = 2L)),
  .verbose = FALSE
)
plot_ica_ncomp_params(obj)