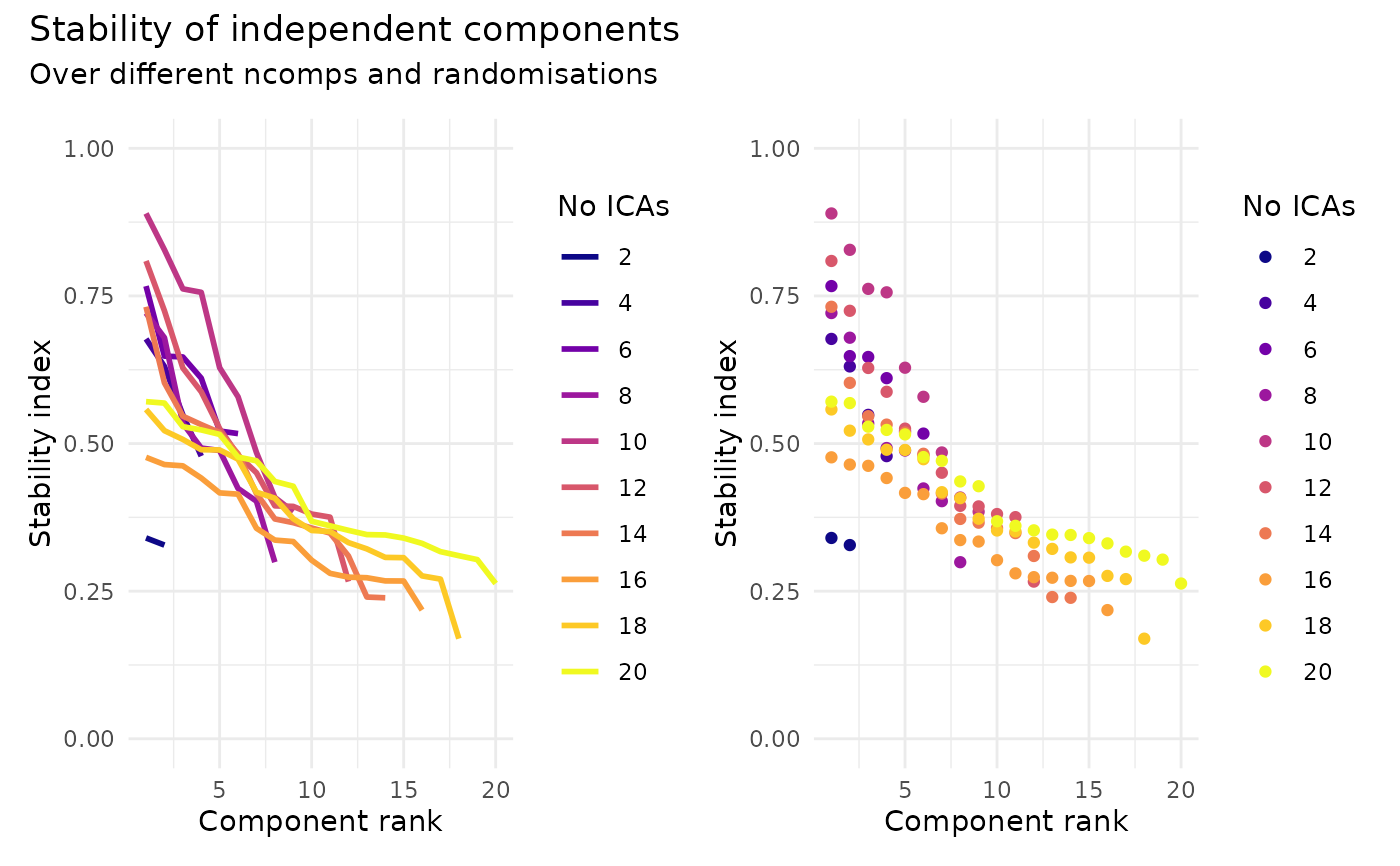
Plot the stability of the ICA components
plot_ica_stability_individual.RdHelper function to plot the individual stability profiles over the tested ncomps.
Arguments
- object
The class, see
BulkCoExp(). You need to applyica_evaluate_comp()before running this function.
Examples
# per-component stability profiles across the tested ncomps
mat <- t(synthetic_signal_matrix()$mat)
obj <- BulkCoExp(mat, data.table::data.table(sample_id = rownames(mat)))
obj <- preprocess_bulk_coexp(obj, hvg = 0.3, .verbose = FALSE)
obj <- ica_processing(obj, .verbose = FALSE)
obj <- ica_evaluate_comp(
  obj,
  ica_type = "logcosh",
  ncomp_params = params_ica_ncomp(custom_seq = seq(2L, 20L, by = 2L)),
  .verbose = FALSE
)
plot_ica_stability_individual(obj)
#> Warning: Removed 1 row containing missing values or values outside the scale range
#> (`geom_line()`).
#> Warning: Removed 1 row containing missing values or values outside the scale range
#> (`geom_point()`).