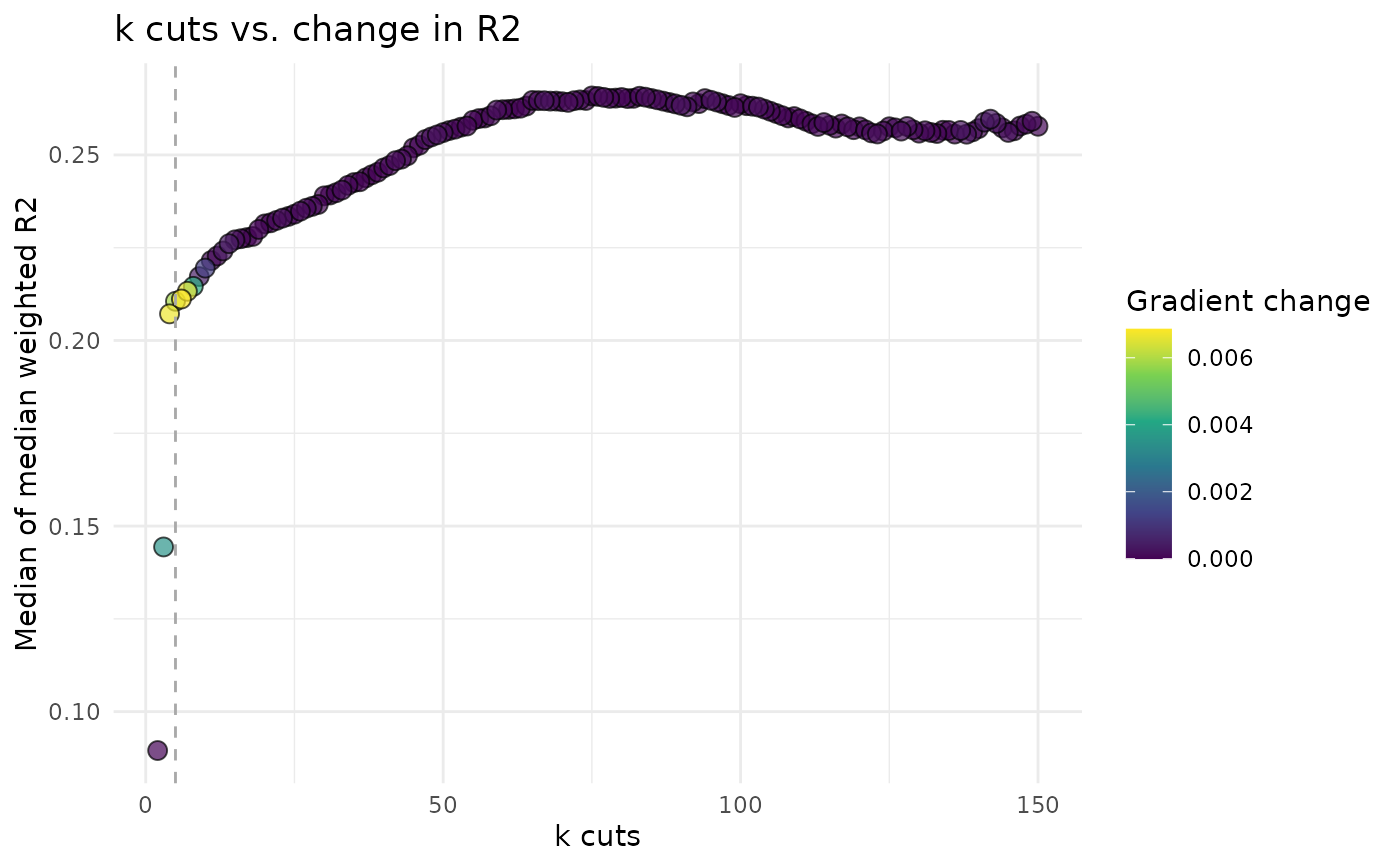
Plot the k cuts vs median R2
plot_optimal_cuts.RdPlots the optimal k vs. median of median R2 graph to identify the optimal number of cuts.
Arguments
- object
The class, see
BulkCoExp().
Value
If optimal cuts results were found, returns the ggplot. Otherwise, throws a warning and returns NULL.
Examples
# k cuts versus median R2, with the chosen cut marked
mat <- t(synthetic_signal_matrix()$mat)
obj <- BulkCoExp(mat, data.table::data.table(sample_id = rownames(mat)))
obj <- preprocess_bulk_coexp(obj, hvg = 0.3, .verbose = FALSE)
obj <- cor_module_processing(obj, cor_method = "spearman", .verbose = FALSE)
obj <- cor_module_coremo_clustering(obj, .verbose = FALSE)
plot_optimal_cuts(obj)