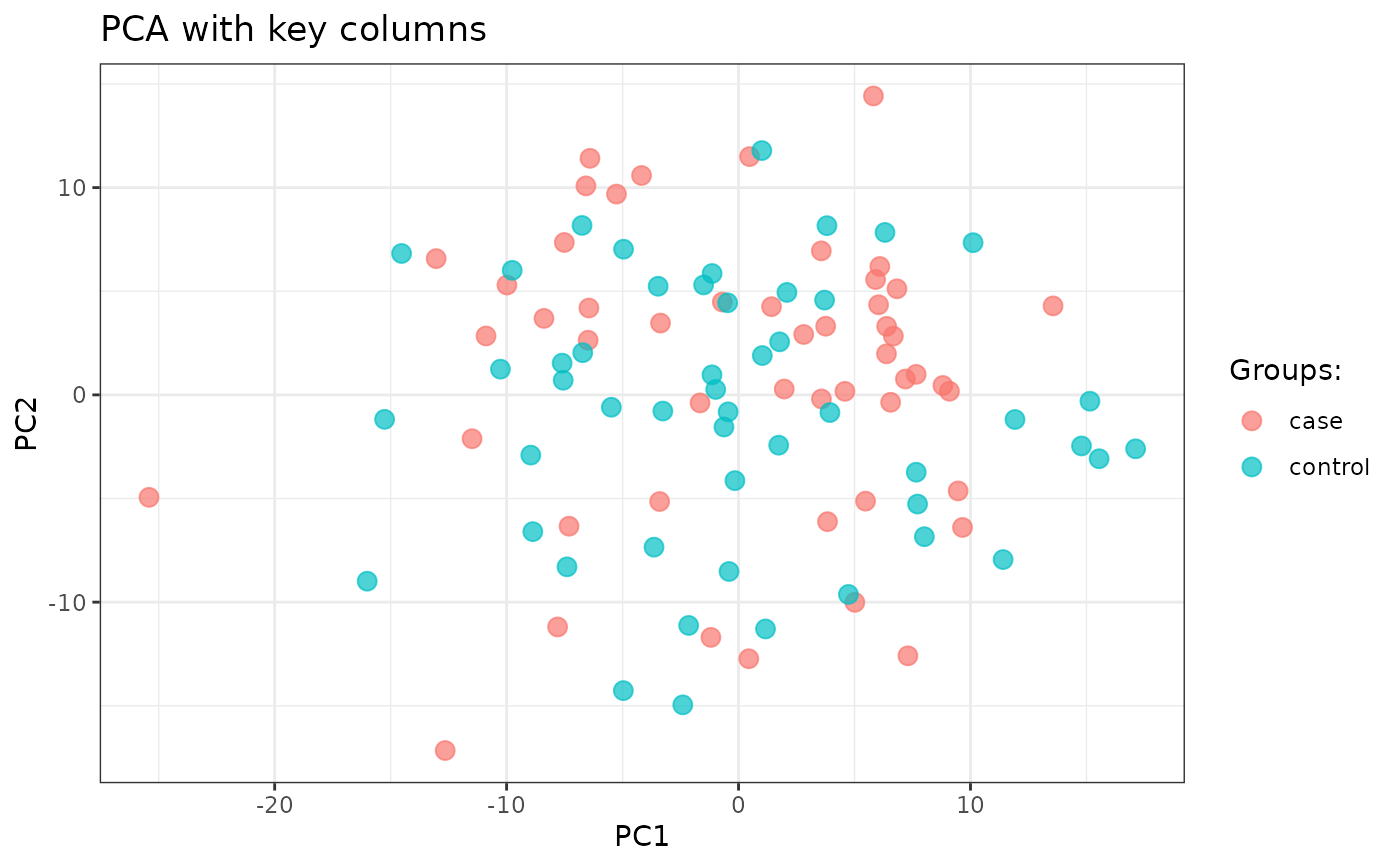
Helper plot function for pca with contrasts
plot_pca.RdHelper plot function for pca with contrasts
Examples
# PC1 against PC2, coloured by the named grouping column
syn <- synthetic_bulk_cor_matrix()
pcs <- stats::prcomp(t(log1p(syn$counts)))$x[, 1:2]
pca_dt <- data.table::data.table(
  PC_1 = pcs[, 1],
  PC_2 = pcs[, 2],
  cohort = rep(c("case", "control"), each = 50)
)
plot_pca(pca_dt, grps = "cohort")