Plot the PCA data
plot_pca_res.RdPlot the PCA data
Arguments
- object
The underlying class, see
BulkDge().- cols_to_plot
String vector. The columns within the meta-data to plot. Defaults to
c('contrast_info', 'sample_source')- pcs_to_plot
String vector of length 2. Will default to
c("PC_1", "PC_2").- ...
additional parameters
Examples
# PCA faceted over the metadata columns you care about
syn <- synthetic_bulk_cor_matrix()
meta <- data.table::data.table(
  sample_id = colnames(syn$counts),
  case_control = rep(c("case", "control"), each = 50)
)
object <- BulkDge(raw_counts = syn$counts, meta_data = meta)
object <- qc_bulk_dge(object, group_col = "case_control", .verbose = FALSE)
object <- normalise_bulk_dge(
  object,
  group_col = "case_control",
  .verbose = FALSE
)
object <- calculate_pca_bulk_dge(object, no_hvg_genes = 500L)
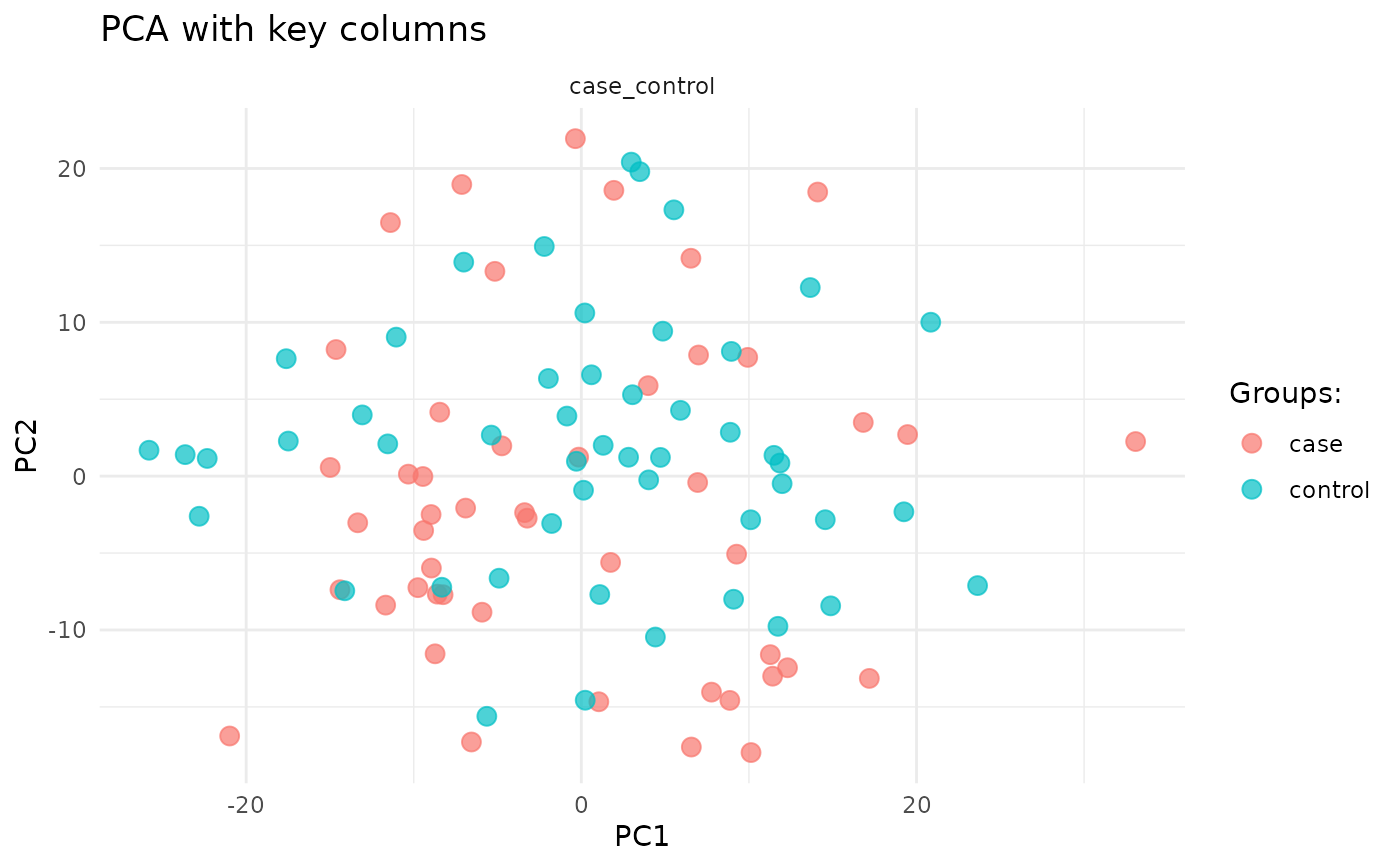
plot_pca_res(object, cols_to_plot = "case_control")