
Plot the Hotspot Z-score matrix
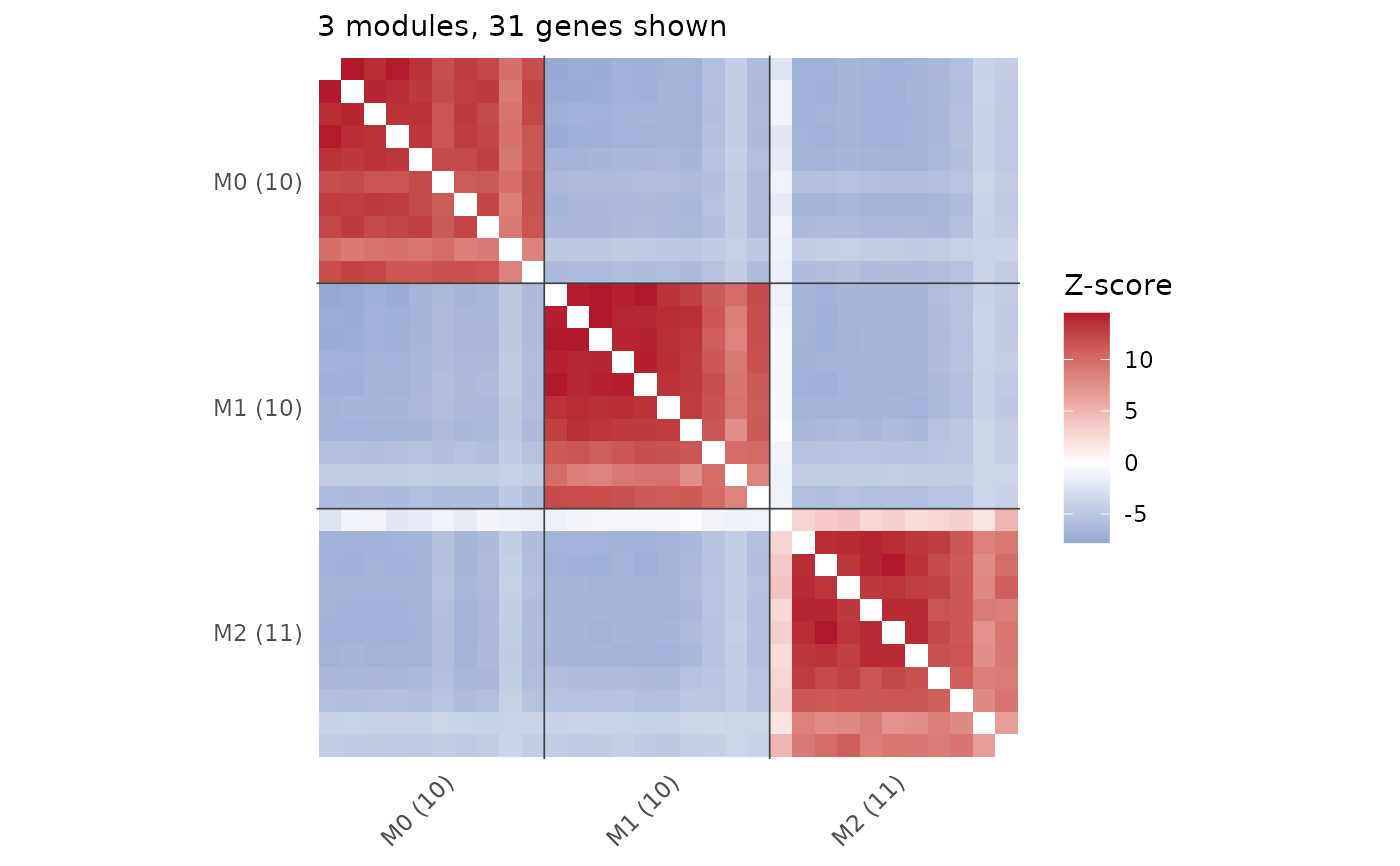
plot.Hotspot.RdHeatmap of the pairwise gene-gene Z-scores. With module membership from
generate_hotspot_membership() the plot keeps the top_k largest modules,
orders genes within each module by hierarchical clustering and separates and
labels the module blocks, so the block structure is actually readable.
Without membership every gene is shown in the order it comes in.
Usage
# S3 method for class 'Hotspot'
plot(x, top_k = 5L, max_genes = 500L, seed = 42L, ...)
Arguments
- x
A
Hotspotobject.- top_k
Integer. Number of modules to keep, ranked by gene count. Set to
NULLto keep all of them. Ignored when no membership has been computed. Defaults to5L.- max_genes
Integer. Maximum number of genes to plot. Above this a subsample is drawn, allocated across the kept modules in proportion to their size. Set to
NULLto disable. Defaults to500L.- seed
Integer. Seed for reproducible subsampling.
- ...
Further arguments (currently unused).
Value
A ggplot2::ggplot object.
Examples
# gene-gene Z-scores ordered by module membership
sc <- demo_single_cells()
hs <- hotspot_gene_cor_sc(sc, .verbose = FALSE)
hs <- generate_hotspot_membership(hs)
plot(hs)
 unlink(sc@dir_data, recursive = TRUE, force = TRUE)