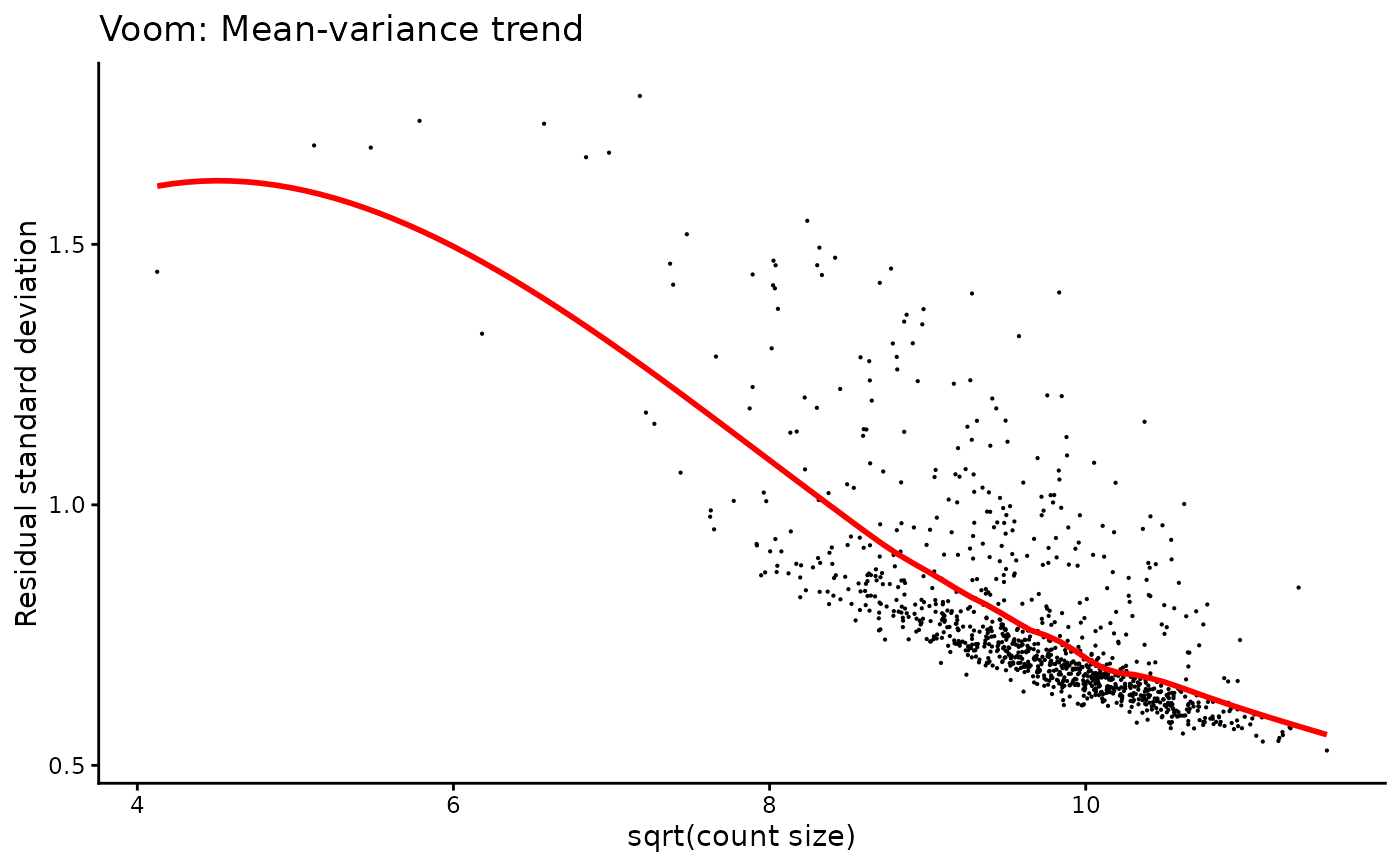
Helper plot function for Voom normalisation
plot_voom_normalization.RdHelper plot function for Voom normalisation
Examples
# mean variance trend after voom
syn <- synthetic_bulk_cor_matrix()
grp <- rep(c("case", "control"), each = 50)
norm_counts <- rs_cpm(syn$counts, lib_size = NULL, log = TRUE,
  prior_count = 0.5)
plot_voom_normalization(norm_counts)
#> `geom_smooth()` using formula = 'y ~ x'